Article overview
- To find where your Shopify checkout loses buyers, compare three counts for the same period: sessions that added to cart, sessions that reached checkout, and sessions that completed checkout. The largest gap tells you whether the problem is...
- It is tempting to skip the first part and start by editing the checkout. But the bigger loss can sit between the cart and the checkout, where the fix is on a different page entirely.
- Shopify's behaviour reports include a conversion rate breakdown and a conversion rate over time report. Both count the same stages:
- Two details in those definitions matter. A session only counts as reaching checkout once the visitor interacts with it, so a buyer who opens the checkout and leaves without touching it is not counted there. And completed sessions can differ...
Putting this workflow into practice? Explore Shopify CRO Consulting for implementation scope, controls, and next steps.
To find where your Shopify checkout loses buyers, compare three counts for the same period: sessions that added to cart, sessions that reached checkout, and sessions that completed checkout. The largest gap tells you whether the problem is before checkout or inside it. Then read the abandoned checkout records to see what happened to real buyers at that step. Only after that should you change anything.
It is tempting to skip the first part and start by editing the checkout. But the bigger loss can sit between the cart and the checkout, where the fix is on a different page entirely.
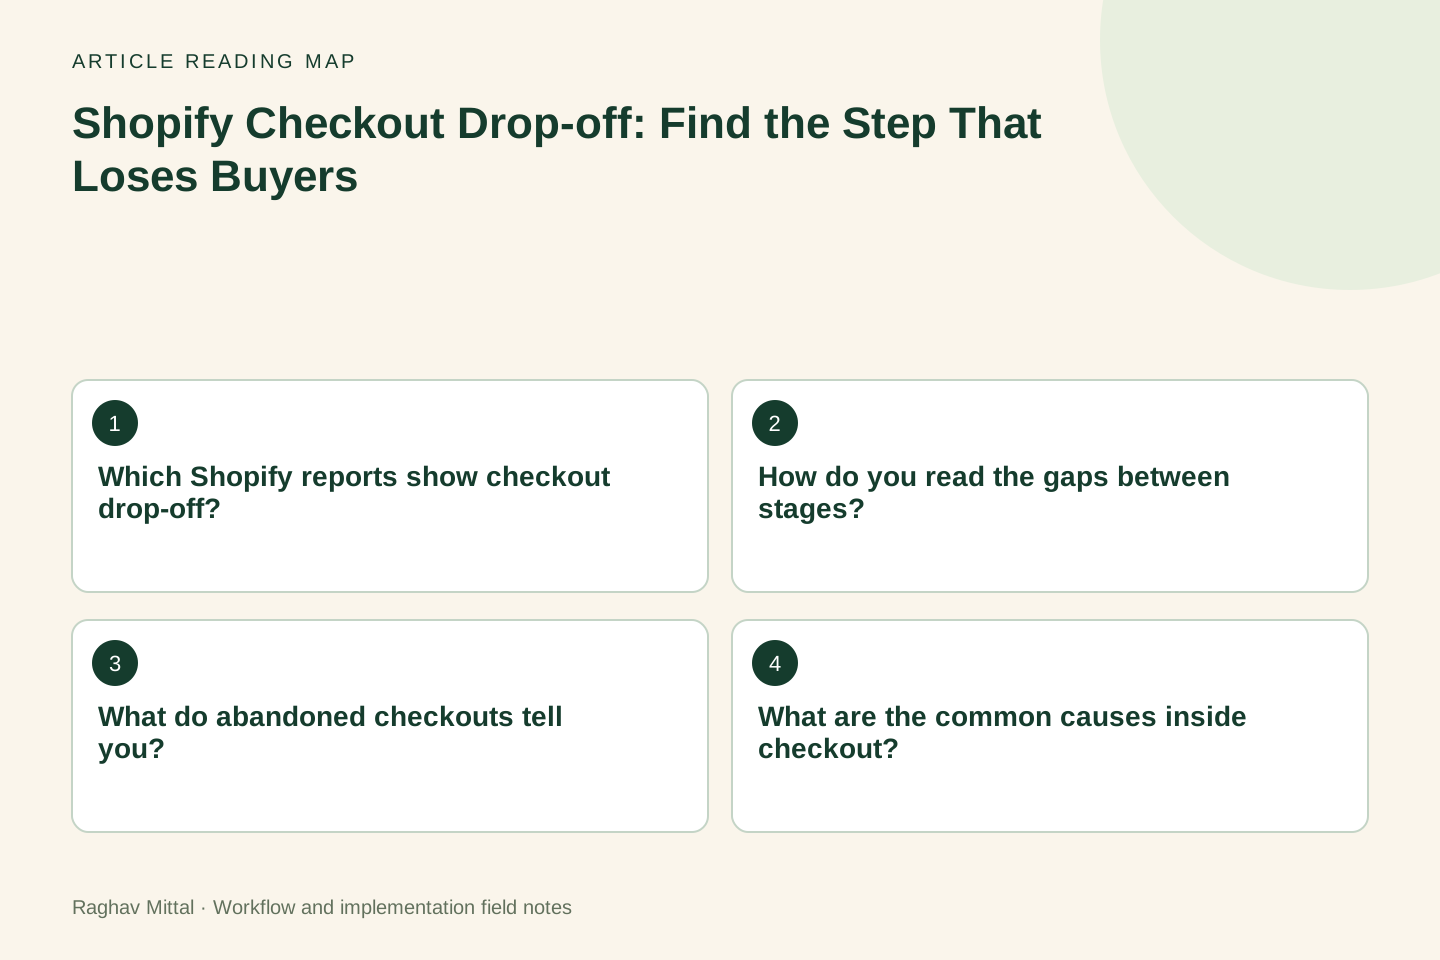
Which Shopify reports show checkout drop-off?
Shopify's behaviour reports include a conversion rate breakdown and a conversion rate over time report. Both count the same stages:
| Stage | How Shopify counts it |
|---|---|
| Sessions | All sessions on the online store |
| Sessions with cart additions | Sessions where a customer added a product to the cart |
| Sessions that reached checkout | Sessions with user input during checkout, such as a key press or click |
| Sessions that completed checkout | Sessions where a customer purchased |
Two details in those definitions matter. A session only counts as reaching checkout once the visitor interacts with it, so a buyer who opens the checkout and leaves without touching it is not counted there. And completed sessions can differ from your order count, because one session can contain more than one purchase. Use the reports to compare stages with each other, not to reconcile against orders.
How do you read the gaps between stages?
Work out two rates for the same date range:
- Cart to checkout: sessions that reached checkout ÷ sessions with cart additions
- Checkout to purchase: sessions that completed checkout ÷ sessions that reached checkout
Then split both by device. A store can look healthy overall and still lose most mobile buyers at one step.
| What you see | What it usually means | Where to look next |
|---|---|---|
| Low cart to checkout, normal checkout to purchase | Buyers stall in the cart | Cart page or drawer, shipping cost visibility, discount code field |
| Normal cart to checkout, low checkout to purchase | Buyers stall inside checkout | Shipping rates, payment methods, form errors, account requirements |
| Both low on mobile only | A layout or speed problem on phones | Test the full journey on a real phone |
| A sudden drop on one date | Something changed | App installs, theme releases, shipping or payment settings on that date |
There is no universal "good" rate. Compare against your own earlier periods and between devices, traffic sources and new versus returning customers.
What do abandoned checkouts tell you?
Reports show how many left. Abandoned checkout records show who and, sometimes, why. Shopify's abandoned checkout documentation says a checkout is treated as abandoned when it stays incomplete for more than ten minutes after the customer has given their email. You find the records under Orders, then Abandoned checkouts, and Shopify deletes them after three months.
Each record has a timeline. Where a payment was attempted, the timeline shows it as a payment event, with a message explaining a failure. Read a sample of at least fifty recent records and tally what you find:
- payment attempted and failed, with the reason given
- shipping address in a region with no rate or a very high rate
- the same customer abandoning several times in one day
- high-value carts compared with average carts
Keep in mind what this view cannot show. A visitor who leaves before entering an email never appears in it. So abandoned checkouts explain losses late in checkout, and the stage counts explain losses early.
What are the common causes inside checkout?
- Shipping cost appears late. The buyer sees the delivery charge for the first time at the shipping step.
- A preferred payment method is missing. This varies by country, so check by market.
- Forced account creation. The buyer must sign in or register before paying.
- Form errors on mobile. Address or phone validation rejects a valid entry.
- Discount code confusion. A code from an advert fails, or the field sends buyers off to search for a code.
- Slow or broken scripts. Apps that load in checkout or on the cart delay the page.
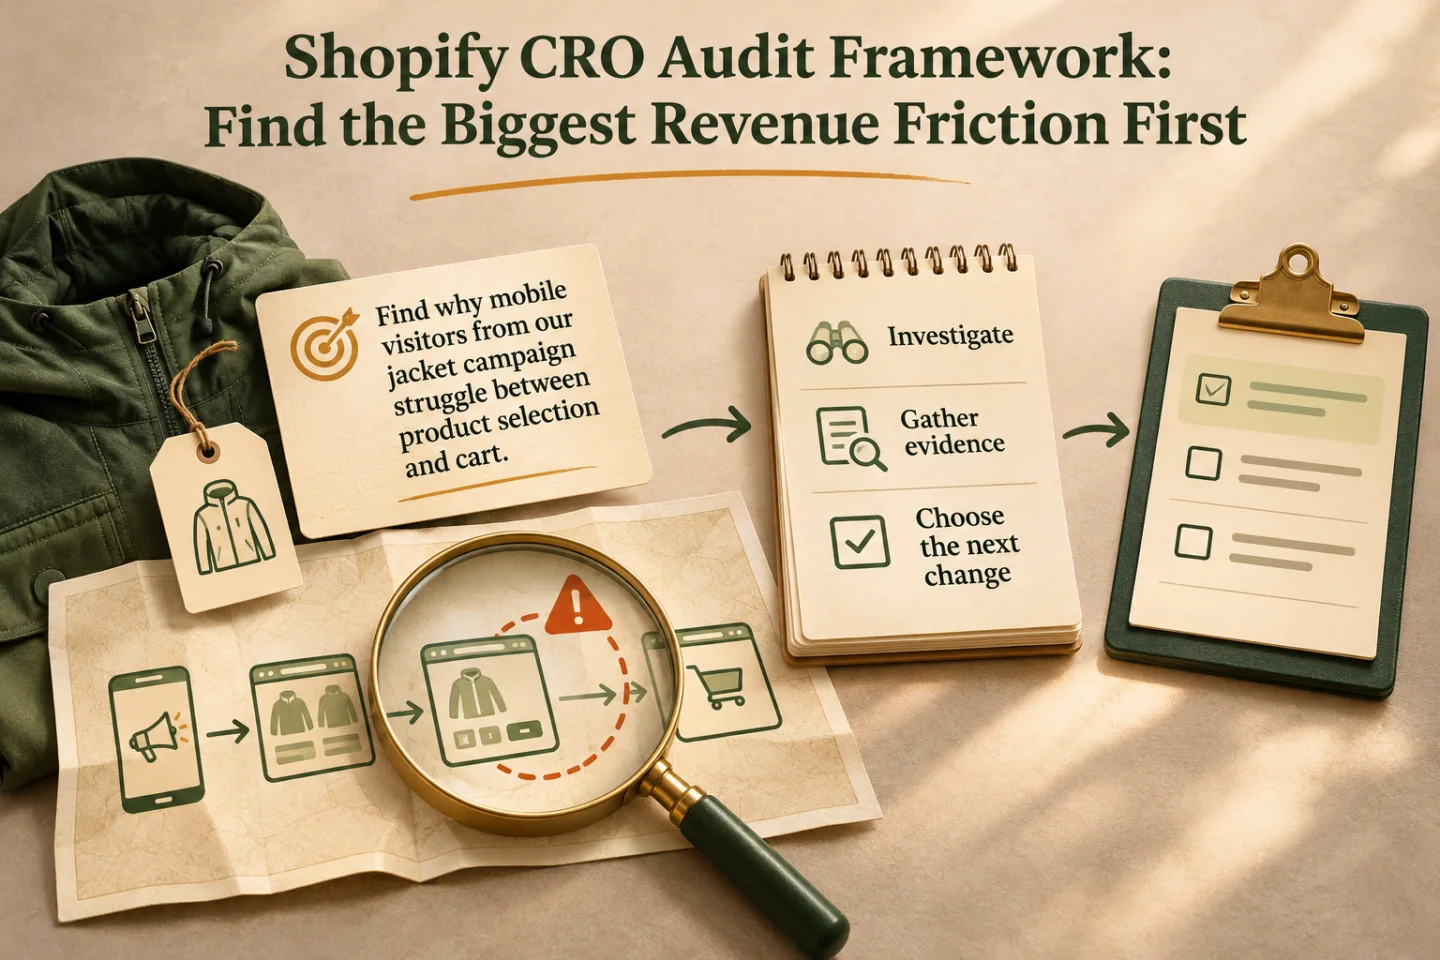
Do not guess which applies. Place a test order on a phone, on mobile data, from each main market, and write down every point where you hesitated. The CRO audit framework explains how to rank what you find by revenue impact.
Worked example: where the loss really was
Illustrative scenario: a store's figures for one month.
| Stage | Desktop sessions | Mobile sessions |
|---|---|---|
| Added to cart | 1,000 | 4,000 |
| Reached checkout | 620 | 1,400 |
| Completed checkout | 430 | 950 |
The numbers are invented for the example. Checkout to purchase is about 69% on desktop and 68% on mobile, so the checkout performs the same on both. Cart to checkout is 62% on desktop and 35% on mobile. The loss is in the mobile cart, before checkout starts. Editing the checkout would have changed nothing. In a case like this the next step is to open the cart on a phone and look for what blocks the checkout button: a drawer that hides it below the fold, a shipping estimate that fails, or an app widget covering it.
What should you fix first?
Fix the stage with the largest loss on the device with the most traffic, and make one change at a time.
- Confirm tracking first. If Shopify, your analytics tool and your ad platforms disagree about purchases, settle that before judging any change.
- Write down the baseline: both stage rates, by device, for the last four full weeks.
- Make one change and note the date.
- Compare the same rates for the following weeks, and check that nothing else changed in that time.
Stores with lower traffic will not get a clean A/B test result in a reasonable time. A dated before-and-after comparison, read with care, is still far better than changing several things at once.
When is the problem not the checkout at all?
When the buyers reaching it are the wrong ones. Traffic from a broad advert or a giveaway can add to cart out of curiosity and never intend to pay. If a drop in conversion matches a change in traffic mix, look at the landing pages and the audience before touching the store. An overloaded app stack is another cause outside checkout; the app stack audit shows how to find scripts that slow every page.
Finding the step that loses buyers is the first part of my Shopify CRO consulting work. You can request a free store audit or send me your two stage rates by device and I will tell you where I would look first.
Frequently asked questions
What is a normal checkout abandonment rate on Shopify?
There is no single normal figure, because it depends on your products, prices, markets and traffic sources. Use your own previous periods as the benchmark, and compare devices and traffic sources against each other to find the outlier.
Why do my Shopify reports and my order count not match?
Shopify's conversion reports count sessions, not orders. One session can include more than one purchase, and a session is only counted as reaching checkout after the visitor interacts with it. Use the reports to compare stages, and use order reports for revenue.
Should I fix the cart or the checkout first?
Whichever loses the larger share of buyers. Calculate cart to checkout and checkout to purchase separately, by device, and start with the weaker one on your highest-traffic device.

Founder, The Night Marketer (Shopify Select Partner). The agency has served 450+ brands since 2015.
Shopify CRO Consulting
I lead Shopify CRO engagements for D2C brands worldwide, with The Night Marketer (a Shopify Select Partner) handling design, development and testing. Every engagement starts with evidence: Shopify analytics, GA4, session recordings, device and traffic-source splits, and a walk through your real buying journey. The output is a prioritised backlog ranked by expected revenue impact and effort, then the fixes shipped and measured.